Media Release
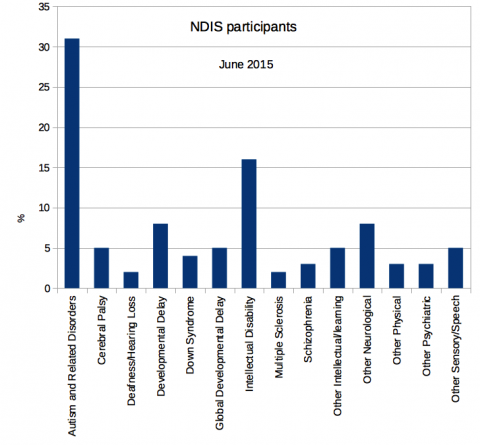
The number of people who are diagnosed with autism spectrum disorder (ASD) continues to rise in Australia. Autism, once considered rare, is now 31% of NDIS participants, the largest disability group in the scheme according to recent the NDIS Quarterly Report issued in June 2015.
The number of NDIS participants with autism indicates that growth in autism diagnoses is not, as some commentators suggest, just due to greater autism awareness and diagnosis of milder cases.
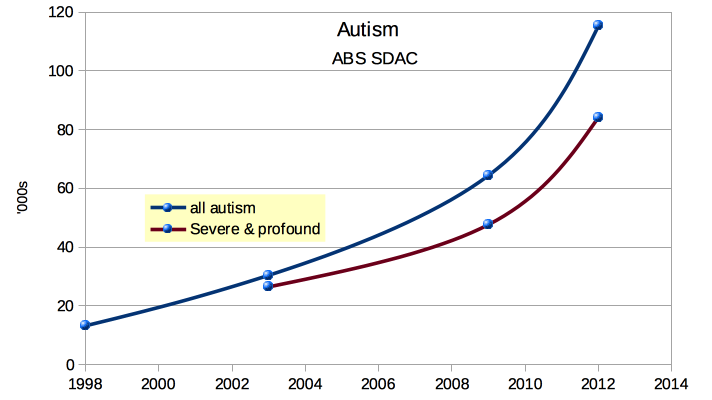
The Australian Bureau of Statistics reported enormous growth in the number of people with autism with data it collected in 2009 and again in 2012 through its Survey of Disability, Ageing and Carers (SDAC).
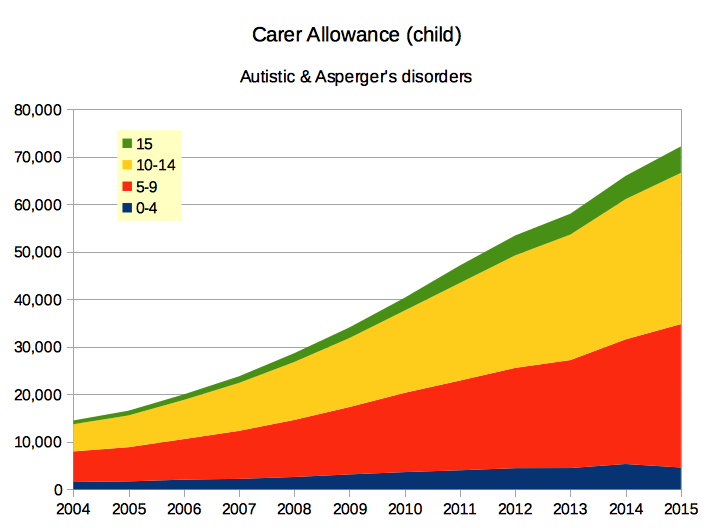
Steady growth can also be seen in the number of families getting Carer Allowance (child) for children (data from Centrelink) who are diagnosed formally with Autistic Disorder or Asperger's Disorder, just two of the autism spectrum disorders.
The Health Department told the Senate Community Affairs Committee (link here) that
The Department does not collect data on autism prevalence. The Department is not aware of any evidence of any major shifts in prevalence of autism in Australia.
A4 has been reporting substantial growth in the number of autism diagnoses for some time (see links below). In 2012, A4 observed that at least 1 in 63 Australian school children has a formal autism diagnosis and was registered to receive Carer Allowance (child).
Graphs showing data from several Government sources appear below.
Autism prevalence is shown in the following table:
| age (years) | ASD | population | prevalence | 1 in x | ||
|---|---|---|---|---|---|---|
| 0-4 | 5748 | 1538952 | 0.374% | |||
| 5-9 | 29027 | 1522192 | 1.907% | 2.060% | 52 | 49 |
| 10-14 | 31840 | 1415903 | 2.249% | 44 | ||
| 15 | 5569 | 287190 | 1.939% | 52 | ||
The US Government's Centre for Disease Control reported similar growth in that country (see link): it reported based on data from 2010 that on average 1 in 68 school children are diagnosed with autism in the USA.
Some relevant links:
- ABC: Autism cases on the rise in Australia
- Nature article - the autism prevalence puzzle
- APAC'09 Prevalence presentation
- autism prevalence continues to rise in Australia - ASfAR Conference 2012 presentation
- Autism/ASD prevalence in Australia ... up to 2012 - APAC'13 presentation
- estimates of autism prevalence in the USA 2014 are 2.24% or 1 in 45
Figures/graphs
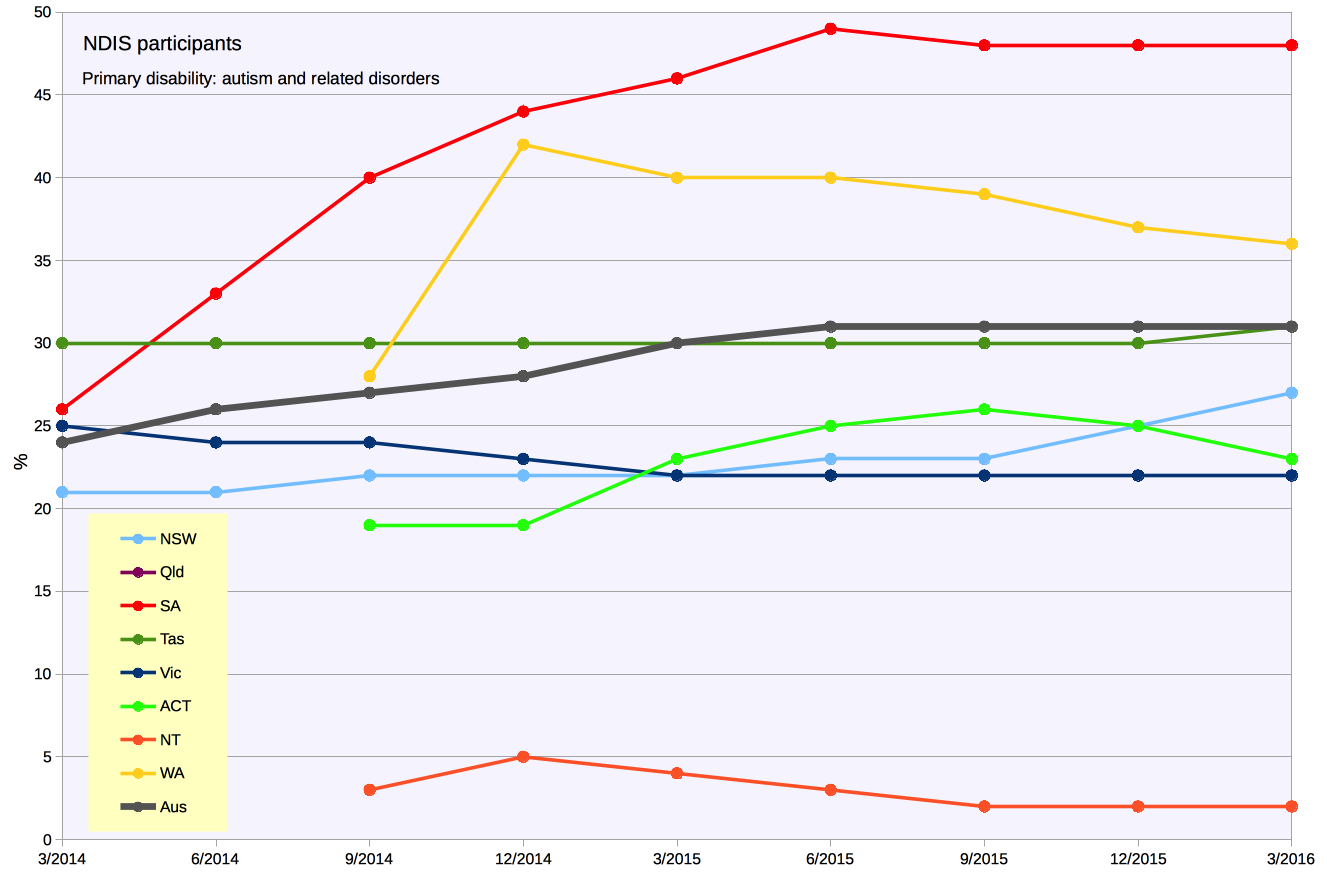
Note: above is an updated graph (to 3/2016), the original graph from this article can be downloaded using http://a4.org.au/sites/default/files/201509-NDISdisabilities.png