

Here is my quick/cursory commentary on the ASD data that the NDIS provided 30/7/2019.
This was the Agency's first "deep dive" into their data. Overall, I welcome this increased reporting on the NDIS. Reporting like this helps identify how the NDIS can improve outcomes for autistic Australians. Article 31 of the UN CRPD requires the dissemination of relevant statistics but other Articles of the Convention indicate the NDIS should consult better about what information is monitored and reported.
Issues that arise with the NDIS's report include:
- The chart on page 15 does not match data reported by A4. Here is A4's chart for the age range 0-15 years:
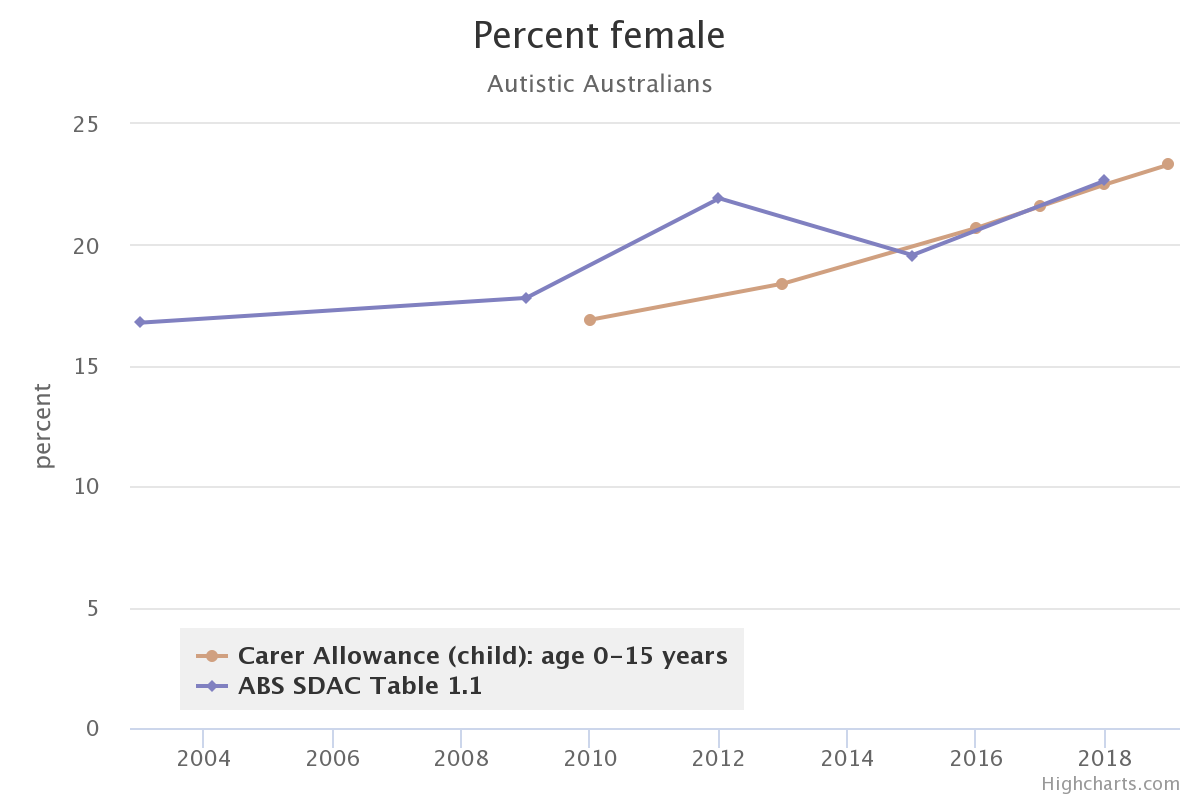
- The NDIS reports (page 16) that there are 51% with “a profound or severe communication restriction” downplays/diminishes ASD severity in the population. The ABS SDAC 2015 report shows 64.8% of autistic Australians have severe or profound disability hence 2 in 3 autistic Australians need substantial support.
- The ABS data shown on page 17 is from the ABS SDAC 2015. It shows growth in ASD reports from Aussies in 3 year periods. You need to imagine what the line will be like for 2018 or 2019 (I hope the ABS will publish/release the 2018-19 data later in 2019).
The ABS did release their data shortly afterwards, see here. It shows a 25% increase in autistic Australians from 2015 to 2018 so A4's concerns were justified. - the figures on page 20 compare 2015 ABS SDAC data with 2019 NDIS data. This is misleading - you need to imagine the growth since the 2015 ABS SDAC data if you want to compare them properly (I challenged the Scheme Actuary on this; she said there was no reason to believe ASD diagnoses increased from 2015 to 2019 - I have since provided them with the Carer Allowance (child) data that also shows substantial growth in numbers). If you compare their data with where the ABS data is likely to be in 2018-19, the match is nowhere near as good as their charts suggest. The NDIS refuses to recognise that ASD diagnoses are increasing substantially.
See the comment about ABS 2018 data above. - in page 21, ACT and WA have always had low ASD diagnosis rates - this is not new.
- on page 23, it's interesting that young autistic girls seem less able to access the NDIS. Carer allowance data, not just ABS SDAC data, says diagnosis rates for younger girls has increased - so why are they not eligible for NDIS?
- page 31 shows the ineligibility rate. It would be valuable to understand why 1 in 8.5 applications are deemed ineligible.
- On page 39, it is hard to tell which state/territory some of the lines related to in the By State/Territory plot. SA has especially low (but improving) levels of committed supports which indicates a serious problem with the NDIS planning process. We need to understand why there are different levels of support in different states/territories.
- the chart on page 40 is pretty meaningless; it just shows that the NDIS does not fund evidence-based early intervention or support autistic school students. It compares funds for autistic children with funds for adults with other disabilities. That makes very little sense.
- the charts on page 41 basically show why we can expect that outcomes for autistic students are unlikely to improve. The figures for 0 to 6 compared to 7 to 14 shows that the NDIS does not fund intensive early intervention. I'd go so far as to suggest this indicates the NDIS is engaged in disability discrimination against autistic students through denying young autistic children essential service in the form of intensive individualised ASD-specific early intervention as is advised repeatedly to be needed by relevant experts. Section 45 of the DDA 1992 makes such discrimination lawful - it protects, possibly promotes, this disability discrimination.
Also, why would autistic people aged 15-24 need so much less funding than people with other disabilities? - the charts on page 42 show the result of underfunding younger autistic people. Skimping on funding early, means later outcomes are worse and the cost is higher.
The charts have different Y-axes which makes them difficult to interpret.
The NDIS provided me with the charts from page 41 & 42 but with data up to March 2019. I created this chart from the March 2019 data. It suggests that lower funding for young people results in greater overall cost since older adults need more support as a result.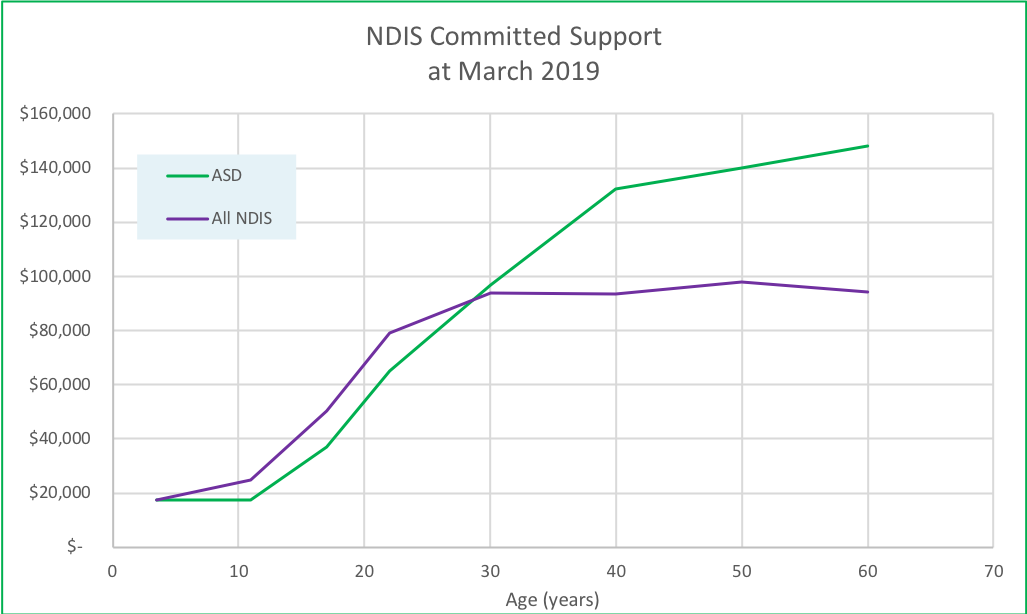
- pages 43 & 44 shows people generally have trouble using their NDIS plans. This issue needs to be much better understood …
- page 45 - we need to know why people put ASD as secondary, especially to ID - the DSMs suggest this would rarely be the case. Anecdotally, it's about the NDIS reference packages - people believe you get better funding this way ... which means the NDIS system is broken since function not diagnosis is supposed to be the key factor in deciding supports.
- page 46 - this is interesting. Normally we expect 30-50% with ID. It seems to suggest quite low levels of other diagnoses for autistic Aussies. It seems that diagnostic practice in Australia is to diagnose ASD and stop diagnosing anything else. A4 said this was happening and predicted that the new ASD diagnosis guidelines would not improve it.
- page 55, this data with data earlier in the report suggests that autistic children who have more concerns get less support - that's not how the NDIS is meant to work.
- Pages 71 & 72, suggest autistic participants have less choice. They may be more comfortable in their family home not going out. This does not look like a good outcome.
The thing people don't talk about in relation to the chart on page 17 is that either there is an extremely high mortality in young autistic adults (which I don't think is happening like this would indicate), or there is massive - really really massive - under-diagnosis of autistic adults (much more likely). The Alliance call for funding for ASD diagnosis after age 13 years might be a step - but the Government has yet to even recognise the Alliance's call for this.
The NDIS developed its reporting and “outcomes framework” without consulting ASD representatives and without considering the advice they have given.
The report lacks overall figures. The information is available: Y6Q3 Quarterly report (March 2019) says the NDIS had 76,424 autistic participants, and 259,071 participants.
AIHW reporting on the National Disability Agreement (NDA) data shows poor rates of services access prior to the NDIS.
This report does not tell us how many NDIS decisions are subject to internal review, taken further to the AAT and what the outcomes are achieved through the conciliations and external reviews.
ASD severity levels are used in eligibility but are not reported. What is that about?
The report has no reporting on the fidelity of PEDI-CAT for ASD assessment.