
Although the number of people diagnosed with autism is on the rise, the proportion with severe features has declined since 2000, according to a study of children in Western Australia1.
The findings, published 19 January in Autism Research, highlight a shift in the perception of autism. Until the 1990s, clinicians typically diagnosed the condition only when a child had significant intellectual disability or language problems.
“What a child with autism looks like has changed over time,” says lead investigator Andrew Whitehouse, head of autism research at Telethon Kids Institute in Subiaco, Western Australia. “We have greater awareness that autism isn’t just children with intellectual disability who show autistic symptoms; it can be far broader than that.”
The findings reflect a growing appreciation of autism’s heterogeneity, says Santhosh Girirajan, assistant professor of biochemistry and molecular biology at Penn State University in University Park, who was not involved in the study. “We are going away from what we call a ‘classical’ definition of autism,” toward one that is more complex and variable, he says.
Trend tracking:
Whitehouse and his colleagues used the Western Australia Register for Autism Spectrum Disorders to find people diagnosed with autism between 2000 and 2006. They identified 1,252 individuals.
The version of the “Diagnostic and Statistical Manual of Mental Disorders” (DSM) clinicians used at the time listed 12 criteria for the condition relating to social difficulties, communication problems, and restricted interests or repetitive behaviors.
But one aspect of the work is notable: Clinicians in Western Australia rated the severity of behaviors related to each of the criteria on a scale from 0 to 3, with 3 representing the greatest severity. By contrast, clinicians in most countries simply note whether a child meets each of the criteria.
“What the Australians do is unique,” says Eric Fombonne, professor of psychiatry at Oregon Health and Science University in Portland, who was not involved in the study. “The severity of symptoms is something that has been difficult to track in studies.”
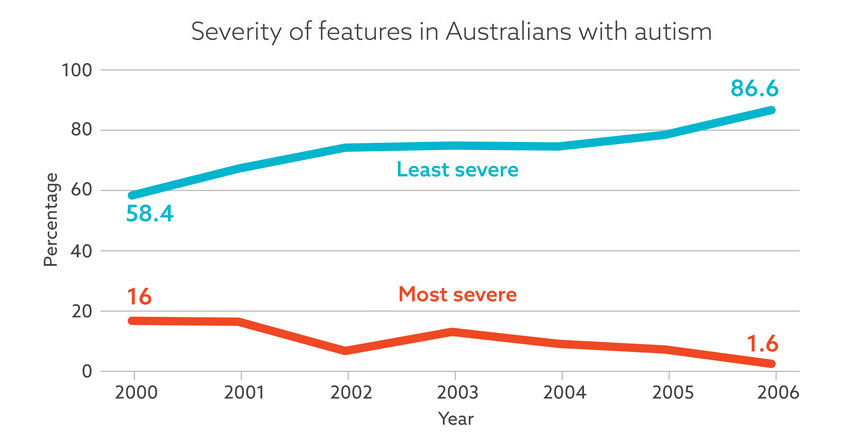
The proportion of people with autism rated as a ‘3’ on three or more of the diagnostic criteria dropped from 16 percent in 2000 to 1.6 percent in 2006, the researchers found. Over the same period, the proportion of people rated as a ‘0’ on three or more criteria rose from 58.5 percent to 86.6 percent.
Changing criteria:
The researchers saw shifts in severity across all types of autism features, including social difficulties, communication problems, restricted interests and repetitive behaviors. These shifts did not vary significantly by the age or sex of the individuals.
Increased overall awareness of autism may contribute to the diminishing proportion of severe cases, Whitehouse says. Government policies that incentivize parents to seek a diagnosis in order to access services may also be a factor, he says.
Studies suggest that changes in diagnostic criteria have played a role in the overall uptick in autism prevalence. But the new study controlled for this factor, because there was no change in criteria over the six years the study covers.
“What shocked me the most is that these changes occurred many years after the last change in the DSM,” Whitehouse says. “So it actually shows us that, as clinicians, our interpretation of diagnostic criteria is a living and evolving thing.”
The study covers a relatively short time period, and it is unclear whether the results generalize to other parts of the world. “But the fact that they still found this is telling you something,” Fombonne says.
Replicating the findings in a larger population might help researchers pinpoint which diagnostic criteria show the greatest shifts in severity — and in doing so, better define the core features of autism.
from https://spectrumnews.org/news/new-autis…;
Editorial comment.
It is important to recognise that autism diagnoses in Western Australia are not typical of the rest of the country (see Variability of autism/ASD prevalence between Australian states). The graph in the article above relates to Western Australian, not to Australians generally.
Surely the major news, if the data in the graph above really does reflect autism severity over time in Western Australia (note I could not find the figure above or its data in the peer reviewed paper), is that "most severe" autism dropped from 16% to 1.6% while autism diagnoses grew in numbers from 106 diagnoses in 2000 to 254 in 2006. Simply, according to the research results there were about 17 "most severe" or "extreme" autism diagnoses in 2000 and about 4 "most severe" or "extreme" cases in 2006 (about 4 times fewer). This represents a substantial drop in cases of "most severe" or "extreme" autism over the 7 year period. If it's true, this is pretty positive news.
The data also indicates a drop in the number of cases with any "extreme" rating at all from 44 cases (58.5%) in 2000 to 34 cases (86.6%) in 2006. Basically, autism in Western Australia was getting milder from 2000 to 2006; there were fewer cases with any "extreme" ratings. This is interesting news ... if it's real.
A possibility exists that the Government funded diagnostic services are increasingly reluctant to rate autistic children as "most severe" for some reason (maybe less willing to give families negative assessments or commit Government to higher levels of support funding). Possibly, the criteria are not just shifting at the moderate/milder end of the scale, but also at the severe/profound end. The paper does not recognise or discuss the implications of 3 in 4 shifting from "extreme" to not extreme autism.